News and
resources

Latest Trends

These are the latest data visualisation trends for 2025

  1. AI generated charts are becoming the new norm as people are now giving their data to AI's
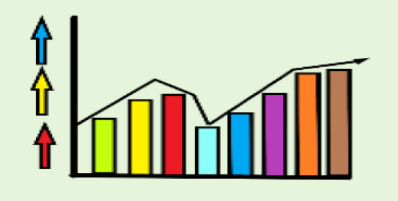
  2. Colour palettes are becoming more vibrant again; in the last 12 years they have been more dulled and grey scale
  3. Government are making some changes as they now require these changes to their charts. Click to find out more
News icon illustration

Research and Insights

Our own research has concluded that within the last 10 years peoples presentations on data have become more vibrant and more colourful. This is not just a coincidence as it has been scientifically proven that peoples attention spans have lowered; this is due to the increase in short term media which has meant presenters need to ensure their presentations are more eye catching, leading to people actually paying attention.

Colourful bar chart illustration